Applications generate massive amounts of data every day, and knowing which numbers truly matter can be overwhelming. A core app dashboard consolidates all critical metrics, insights, and performance indicators into a single, intuitive interface. By providing a clear overview, dashboards help teams quickly identify trends, monitor key metrics, and make informed decisions without the need to dig through spreadsheets or multiple reporting tools.
More than just a display of numbers, dashboards serve as central hubs where developers, product managers, and business leaders can monitor system health, track user activity, and respond proactively. A well-designed dashboard allows teams to prioritize tasks, uncover opportunities, and maintain smooth operations, ensuring that the right information is available at the right time.
What Are Core App Dashboards?
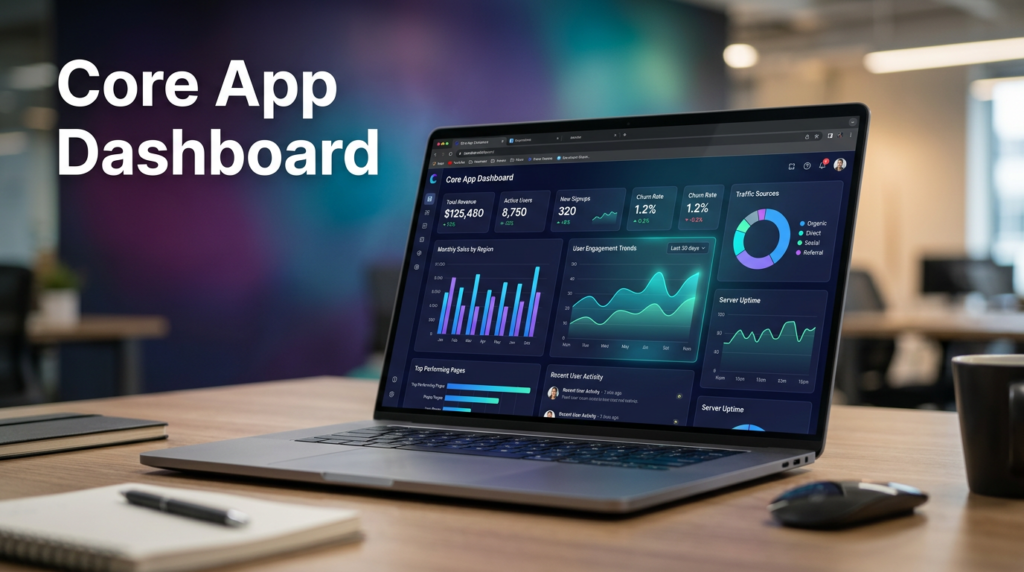
A core app dashboard is a visual interface that centralizes critical data for easy understanding and action. It uses interactive charts, graphs, tables, gauges, and heatmaps to make complex datasets approachable. These visualizations allow users to see patterns, trends, and anomalies at a glance, transforming raw data into actionable insights.
By enabling teams to interact with the data in real time, dashboards accelerate decision-making and help identify opportunities or issues quickly. Whether tracking system performance, user engagement, or business KPIs, dashboards give users the clarity they need to make informed decisions without spending hours analyzing raw numbers.
The Importance of Real-Time Monitoring
Real-time monitoring is one of the most powerful features of a core app dashboard. Unlike traditional reporting tools that rely on historical data, real-time dashboards show metrics as they happen. This allows teams to respond immediately to anomalies, system errors, or changes in user behavior, reducing downtime and improving overall application reliability.
For managers and product owners, real-time insights provide a window into feature usage and customer interactions. Developers can quickly address issues before they affect the user experience, and executives can make data-driven decisions without delay. Continuous monitoring ensures operational efficiency, improves user satisfaction, and allows teams to act proactively rather than reactively.
Core Components of a Dashboard
A successful dashboard combines multiple elements to deliver actionable insights:
- Interactive Filters and Controls: Let users manipulate data views to focus on what matters most.
- Tables and Lists: Provide structured, detailed information for deeper insights.
- Alerts and Notifications: Automatically inform users of critical events or threshold breaches.
- Charts and Graphs: Visualize trends and patterns for quick comprehension.
- Navigation and Login Elements: Ensure smooth movement across dashboard sections with secure access.
- KPIs and Metrics Panels: Highlight essential performance indicators at a glance.
These components work together to make the dashboard intuitive, informative, and responsive to diverse user needs.
Benefits of a Core App Dashboard
A core app dashboard is more than a reporting tool—it enhances productivity, insight, and collaboration across teams:
- Enhanced Interaction: Engage users with intuitive controls and real-time data exploration.
- Better Monitoring: Keep track of system performance and user activity continuously.
- Time Saving: Reduce hours spent gathering and analyzing scattered data.
- Performance Tracking: Observe KPIs over time to evaluate growth and trends.
- Better Decision Making: Access actionable insights that drive informed choices.
By providing centralized access to critical metrics, dashboards allow teams to focus on what matters and act with confidence.
Key Features of a Core App Dashboard
Modern dashboards come with features designed to make data analysis seamless and actionable:
- Interactive Canvas: Explore and manipulate data visually for a deeper understanding.
- Cross-Platform Accessibility: Access dashboards seamlessly across desktop, tablet, or mobile.
- Customizable Views: Personalize layouts and metrics to match roles or preferences.
- Enhanced Analytics: Gain predictive insights and advanced trend analysis.
- Performance Monitoring: Track efficiency, uptime, and user engagement continuously.
- Integration Capabilities: Connect multiple data sources to create a unified view.
- Real-Time Data Updates: Always stay informed with the latest metrics and changes.
These features turn dashboards from static reporting tools into dynamic platforms for strategic decision-making.
Enhancing User Experience with Dashboards
A core app dashboard improves user experience by presenting data clearly and interactively. Visualizations such as charts and graphs make complex information easier to understand, reducing cognitive load and enabling faster decision-making. Customizable layouts let users prioritize the metrics that matter most to their role, while interactive elements such as filters and drill-downs make data exploration intuitive and engaging.
Responsive design ensures that dashboards remain accessible across devices, from desktops to smartphones, allowing users to access insights anytime, anywhere. By combining visual clarity, personalization, and accessibility, dashboards make working with data simpler, more intuitive, and ultimately more impactful.
Best Practices for Dashboard Design
Effective dashboard design begins with a clear understanding of user needs. Every element should serve a purpose, answering key questions that help users take action. Organizing information according to a visual hierarchy ensures that critical metrics are prominently displayed, while consistent use of color, typography, and spacing improves readability.
Reducing cognitive load is essential. Dashboards should avoid unnecessary clutter, present data progressively, and allow drill-downs for more detailed insights when required. By following these principles, dashboards can be both visually appealing and highly functional, ensuring that users can extract insights efficiently and make informed decisions confidently.
Future Trends in Core App Dashboards
Dashboards continue to evolve with technology, becoming smarter and more adaptive:
- AI & Predictive Analytics: Identify trends, forecast outcomes, and detect anomalies before they occur.
- Natural Language Interaction: Users can ask questions in plain language and receive instant insights.
- Personalization & Adaptive Layouts: Dashboards learn from user behavior to highlight the most relevant metrics.
These advancements will make dashboards increasingly essential as intelligent tools for proactive decision-making and operational efficiency.
Conclusion
A core app dashboard is more than a tool for displaying numbers—it is a strategic platform that empowers teams to monitor performance, analyze data, and make informed decisions. By integrating real-time monitoring, interactive visualizations, customizable widgets, and intelligent alerts, dashboards enhance operational efficiency, collaboration, and overall user experience.
As dashboards continue to evolve with AI, predictive analytics, and personalized interfaces, they are becoming essential for organizations of all sizes. A well-designed dashboard transforms raw data into actionable insights, giving teams the clarity and confidence they need to make smarter decisions, optimize performance, and achieve strategic goals across the entire organization.